Interactive Climate Awareness Experience
August 2020 to September 2020
I was given the task to create any digital experience I wanted utilizing the programs that I was taught through this 10 week quarter. I decided that I wanted to create an educational experience to help children understand the effects of climate change and what it is doing to our planet. It is a very important topic that we all need to learn about, especially for our children who will be leading our futures one day. I used a variety of different programs such as Teachable Machine, Touch Designer, and Raspberry Pi to develop this digital educational experience.
The audience I had in mind were young children. I knew that many children don’t know or have not learned about the concept of Climate Change. Climate change is something that is affecting our planet, and our futures. In order to help children understand this, I wanted to create an interactive experience that they would be able to work with. It had many different features that deal with haptic design to allow children to have fun with the experience, while also learning.
This project did not have many constraints at all. We were free to do whatever we wanted to do as long as it was long enough and difficult enough for it to incorporate what we have learned for the past 10 weeks. However, there were some constraints present. Since this class was purely online due to COVID-19, I was restricted to space and what materials I would have been able to use to create the final project. My original idea was to have a full-fledged, water-fall like experience, which would be possible if this project were a long-term project, and not just done in 2 weeks. Hopefully, sometime in the future, the original concept will be made into reality.
The very first thing that I tackled was using “Teachable Machine.” I wanted the different ecosystems to appear depending on which colored post-it was showing. I held up three different colored post-its: Blue, Pink, and Purple. I used Teachable machine and trained it to recognize the different colors whether it was up close or if I was simply holding it up and the camera could view it. When each color was shown, one of the bars would appear to show that it detects from 0% to 100% of the post-it color. I later use Touch Designer to take a screengrab of Teachable Machine and use python in order to control which ecosystems are being shown.

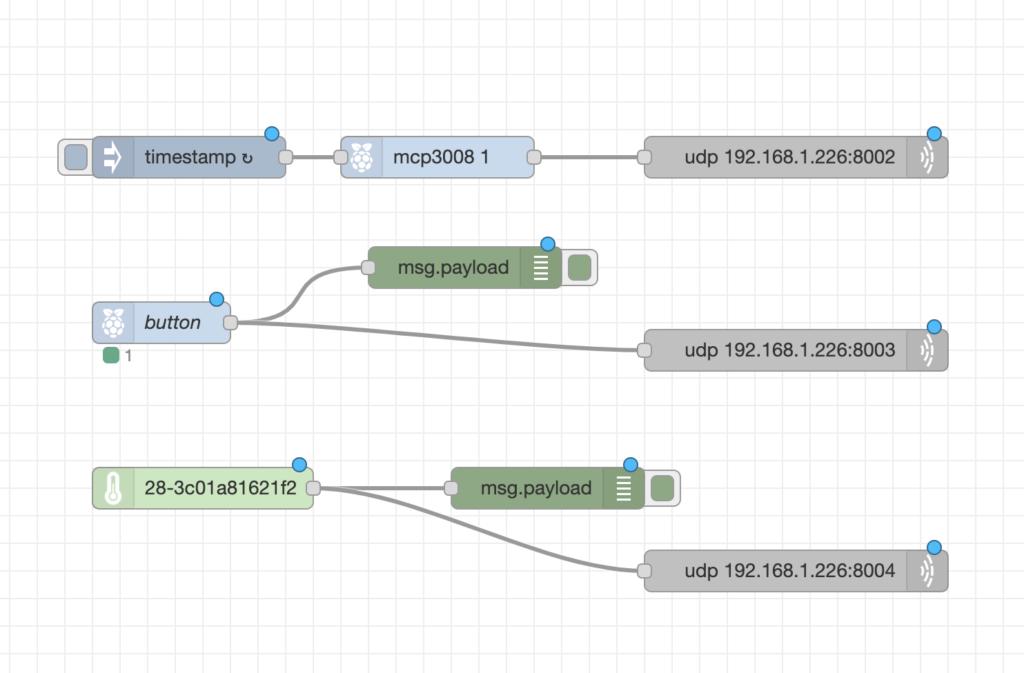
On my raspberry pi, I used three different inputs. One was a button, the other a temperature sensor, and the third was a photoresistor. In order for any of the inputs to be functional, I used node-red to read the outputs for each input used.
Button Input
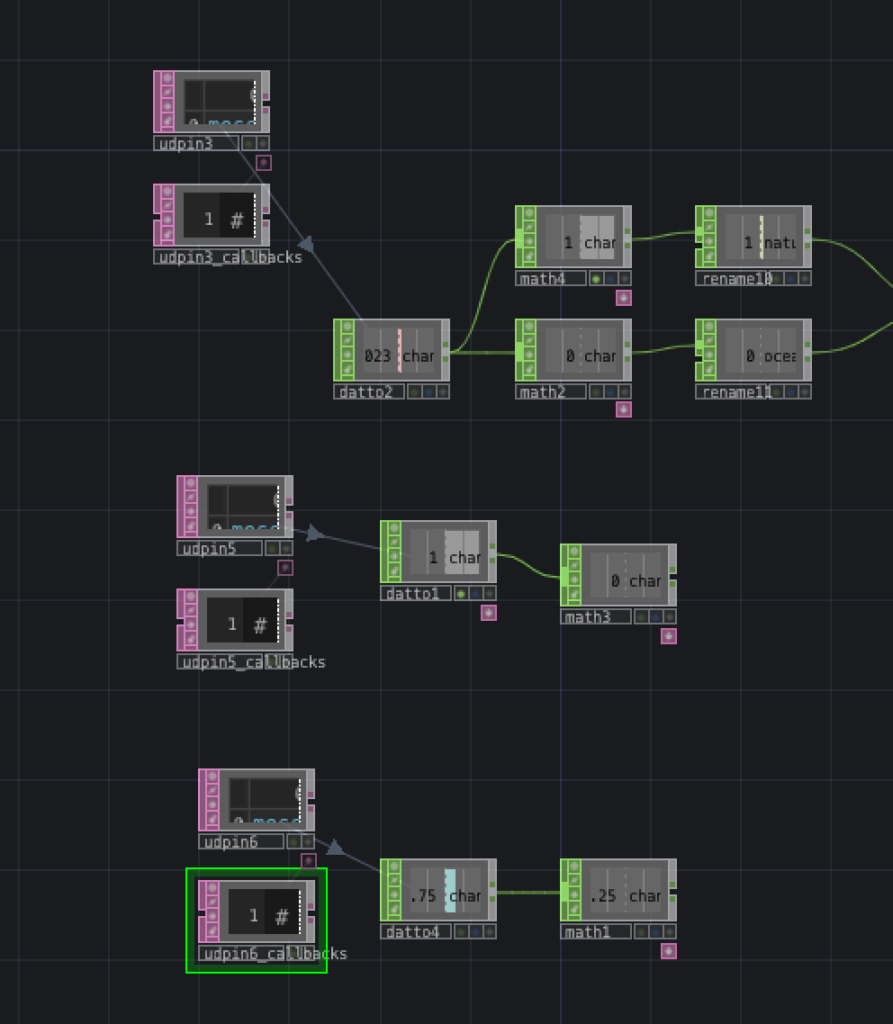
In order for the Button input to work correctly, I first had to hook up all of the wires into the breadboard. Knowing that this would be an interactive piece, I used the wires that allowed the input to used further away from the breadboard itself. If all of the inputs were on the breadboard, there would be much difficulty with the usability of the inputs. After connecting everything, I utilized node-red to read what was going into the input. I went to node-red and used a GPIO to read whenever the button was being pushed. In order to connect, I used the UDP DAT to link to Touch Designer. I then connected a DAT TO CHOP to then read the values that the button was outputting. What I received was a change between 0 and 1. For one of my features to work, it had to change first from 1 and then to 0. In order to do so, I simply created a MATH CHOP to help change the way the number was ordered.
Temperature Input
The second Input I utilized was the Temperature Input. Just like I did with the Button input, I wired up everything onto the breadboard and used a special wire in order to have the sensor away from the breadboard to increase the usability of the experience. Once connected, I used the GPIO since I was not using the Digital to Analog. From here, node-red was reading my temperatures and I connected it to Touch Designer, using the UDP CHOP. After everything was linked to Touch Designer, I used another DAT TO CHOP in order to bring out the data. From here I used a MATH to fix the range for the temperature to later be easier to pick-up and be reading by the python.
Photoresistor Input
The last input I used was the Photoresistor Input. After wiring everything to the breadboard and using wires to increase usability, In node-red I used the A/D converter and a timestamp in order to record the changes in light for the photoresistor. The photoresistor’s function was then connected to touch designer using UDP. I used a DAT TO CHOP to bring the output into touch designer. The Photoresistor controlled the sounds that the user would be experiencing. I didn’t want the user to cover the Photoresistor with their hands. So, I created a small cover that would cover the Photoresistor and can also be taken right off. It is interactive with the sounds as well as allowing the audience to have a hands-on experience. In order for the sounds to come through, I used python to create 1 and 0 values each time the cover was put onto the Photoresistor and taken off. When the cover is on, the sounds of birds and nature fill the room. When the cover is taken off, the sounds of the ocean turn on while the sounds of nature turn off.


Step 1: The first thing I did when turning on Touch Designer was to create a Screen Grab DAT. The Screengrab takes whatever is on the screen and brings it into Touch Designer. The Screen Grab was taking in the colors of the different bars that Teachable Machine had. I then created several different Crop DATs in order to take each individual colored bar from Teachable Machine. I manipulated the levels so when the colored showed up, it turned black. But when the colors disappeared, the colors turned white. I then used tops in order to make these act as if they were on and off switches. Each time a color came onto the screen, the values would change from 1 to 0. To properly make sure that these were turning on the correct way, I implemented maths onto each to change their ranges. After this, all of the MATH CHOPs were merged together into another CHOP and connected to Python Scripts. The Python Scripts helped to correlate each post-It that was trained in Teachable Machine to output their data. When the data was outputted and received by a teachable machine through the screengrab, the numbers within the table next to the python script would output a number 1. If a certain color of a post-it had not outputted its data from Teachable Machine, then the number turned to zero. I also wanted to incorporate the temperature sensor into the python as well. If the temperature got to a certain point, I wanted another number on the table to change from 1 to 0. I wrote this into the python, and it happily worked.

Step 2: The next thing that I did was to try and grab the data that was being outputted from the chart. Every time a 1 appeared on the table, I wanted a certain video/visual to show up. While the temperature was lower, exosystems would be shown as their beautiful selves. When the temperature reached past a certain point, I wanted different visuals to be shown of the ecosystems once they were affected by climate change. The major problem that I face was trying to figure out how to transfer the data from the table into a chop. I used so many different CHOPS ranging from SWITCH to SELECT and many more. Eventually, I figured out that I should use a DAT TO CHOP just like I did for the UDP. Then I selected the individual rows from the table and took their values. I made sure that for each time that a 0 turned into a 1, a different video appeared on the screen. I linked the DAT TO CHOP’s NULLS to the opacities in each of the visual’s levels, which would then give the illusion that the videos were turning on and off corresponding to the Post-its being shown.
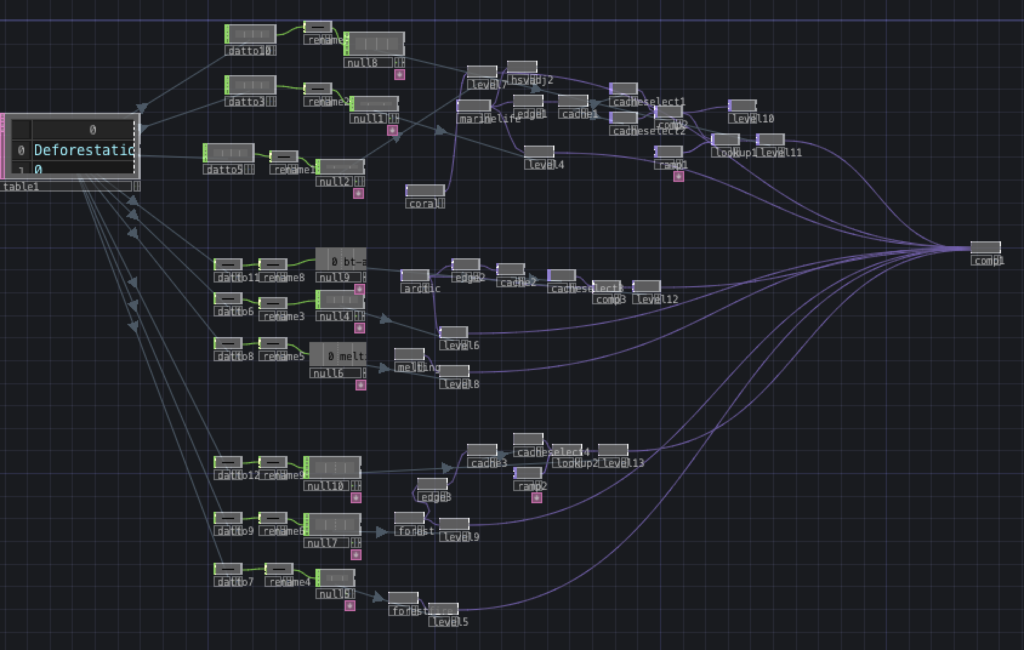
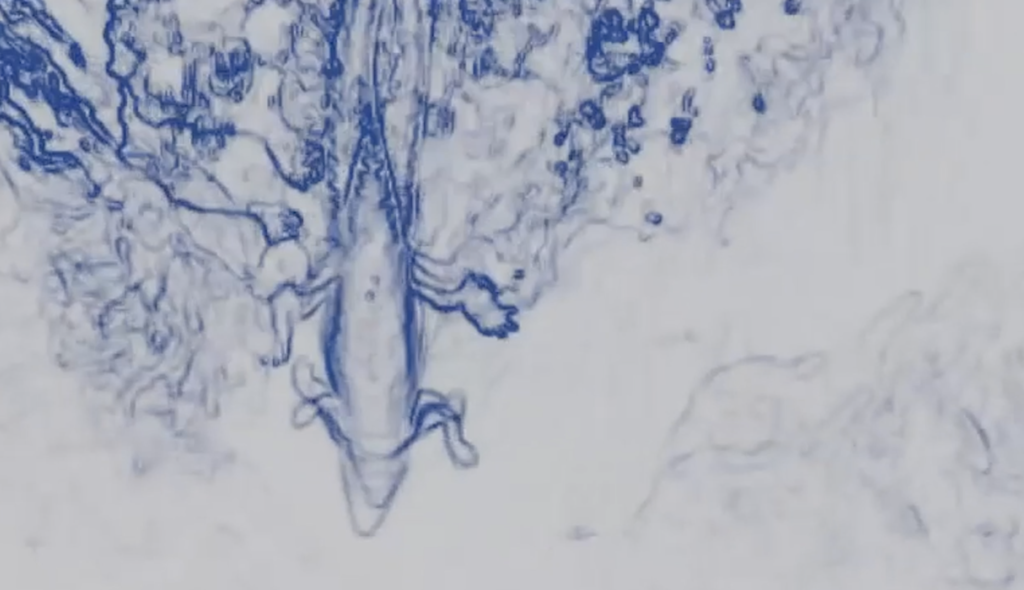
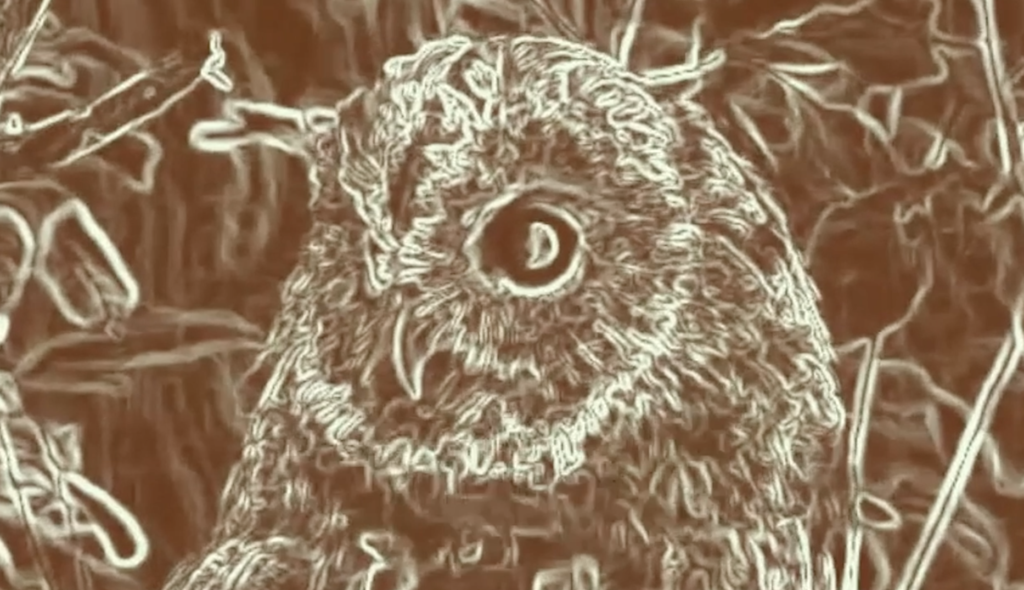
Step 3: The next thing I did was to have the button input activate a manipulation onto each of the visuals that the audience sees. The first thing I did was create the manipulation of the visuals. I duplicated each of the normal, unaffected climate change visuals, and put an EDGE onto each of them. This helped to provide an outlined look of each of the objects detected within the visuals. For the forest, I had it outline in green while having the background brown to encapsulate the colors of the forest. For marine life, I changed the background to blue and the outline to white. For the arctic, I simply had a white outline. Instead of it just being an outline, I also attached a feedback. This allowed a short delay in when the outline would catch up with the real visual. The next and last step was to attach the button to the opacity of each of these manipulations so they would activate once the button was pressed. I simply went to the Python code and changed it so when a button was pressed, the number 1 would show up on one of the rows in the table.

I was really happy with how my project came out to be. I was able to bring in all the knowledge that I have learned throughout the quarter. When connecting everything together from the Raspberry Pi to Touch Designer, I felt more confident that I have been before.
When first using Touch Designer, I felt as though I had no clue about what I was doing. I was placing different elements onto the screen, but couldn’t grasp the concept. It wasn’t until this final project that I realized that I did understand the concept. The moment that I realized that I got it, I understood how to use Touch Designer freely on my own when I was trying to turn the data from the tables and bring them into a CHOP for the visuals. From what I see now, the step should have been easy to figure out, but took me about an hour to finally figure out the correct CHOP to input.
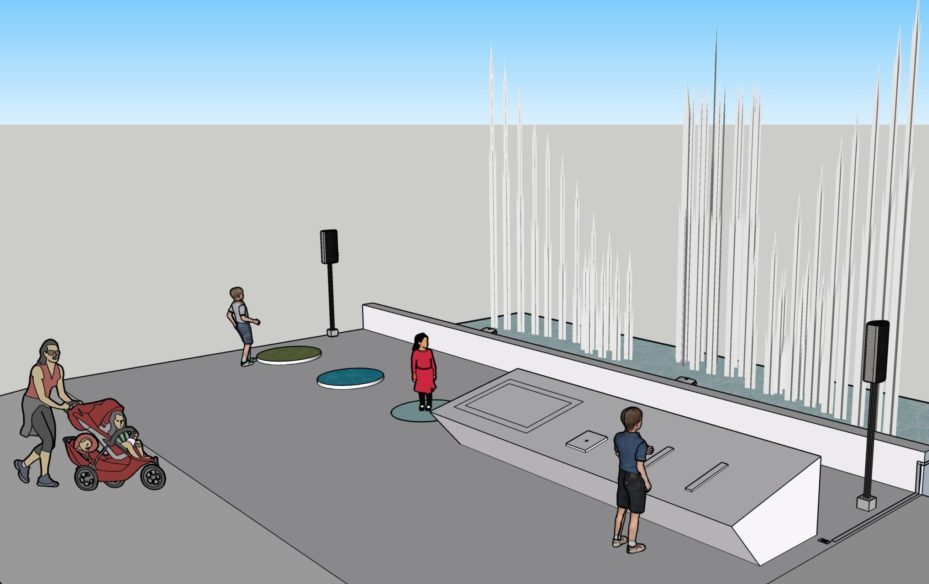
Overall, I am very happy with how this project turned out. One day when we are out of quarantine and I have gained more experience in interactive Exhibits, I would like to go forth with my initial concept idea of having a Water Fountain that acts as a projection background. My inspiration for the concept idea from Disney’s Fantasmic Water shows. I wanted to be able for users to stomp onto floor buttons to change the ecosystems that the projectors would project onto the fountain. There would also be a panel where users would be able to manipulate what was projected just like how this final project did.
